Adopting observability can be challenging for many engineering teams. In environments with dozens or even hundreds of microservices, convincing product and engineering teams to manually instrument their applications can be a slow and exhausting process. OpenTelemetry’s auto-instrumentation, also known as zero-code instrumentation, emerges as a solution to accelerate this adoption by providing immediate visibility without requiring code modifications.
Types of Instrumentation and Their Roles Link to heading
We can split OpenTelemetry instrumentation into two major categories:
- Manual: Requires changes in the application code to collect observability data — such as spans, metrics, or logs. It offers full control and allows inclusion of business-specific information.
- Automatic (auto-instrumentation): Utilizes agents that inject instrumentation libraries at runtime to automatically capture telemetry from popular frameworks, without changing the code. It’s ideal for fast adoption, though it provides more generic data.
Benefits of Auto-Instrumentation Link to heading
- Fast Adoption: Teams can start collecting observability data without modifying code.
- Standardization: Instrumentation is consistently applied across all services.
- Reduced Effort: Developers can focus on delivering features instead of complex integrations.
Challenges of Auto-Instrumentation Link to heading
- Limited Contextual Information: Automatically collected signals may lack business-specific attributes, making it harder to extract meaningful insights.
- Performance Overhead: Although the libraries are designed to minimize impact, runtime instrumentation can introduce some latency, especially in high-throughput applications.
- Limited Fine-Grained Control: Developers have less control over what gets instrumented and how signals are structured.
- Potential Compatibility Issues: Some frameworks or libraries may not be fully supported by auto-instrumentation, resulting in gaps in observability. Also, not all languages are supported — see the full list in this documentation.
- Increased Debugging Complexity: Since instrumentation is applied dynamically, troubleshooting unexpected behaviors may be more difficult compared to manually instrumented applications, especially for interpreted languages.
The OpenTelemetry Operator Link to heading
In Kubernetes environments, the OpenTelemetry Operator is a key component for scaling auto-instrumentation across the cluster. It manages automatic instrumentation by injecting agents into containers without requiring changes to application manifests.
While it’s possible to enable OpenTelemetry instrumentation by modifying Docker images or using custom entrypoints — either by altering each app image individually or using a shared base image — this approach increases operational complexity. Every image update must include the necessary dependencies, making maintenance harder.
The Operator utilizes Kubernetes mutating webhooks to intercept pod creation requests. When a new pod is created, these webhooks automatically modify the pod specification to include the appropriate instrumentation agent based on the annotations and language detected. The agent then loads the instrumentation libraries during application runtime to collect telemetry data.
This architecture allows the Operator to automatically detect applications and inject the necessary agents, which then load instrumentation libraries to collect traces and metrics at runtime. Additionally, it allows centralized configuration of OpenTelemetry settings, such as custom sampling strategies, attribute enrichment, and export configurations. This not only lowers the adoption barrier for development teams, but also provides a scalable and maintainable approach to observability.
The diagram below shows how the Operator works, illustrating the flow from the mutating webhook intercepting deployment requests to the instrumentation agents collecting and sending telemetry data to the backend systems.
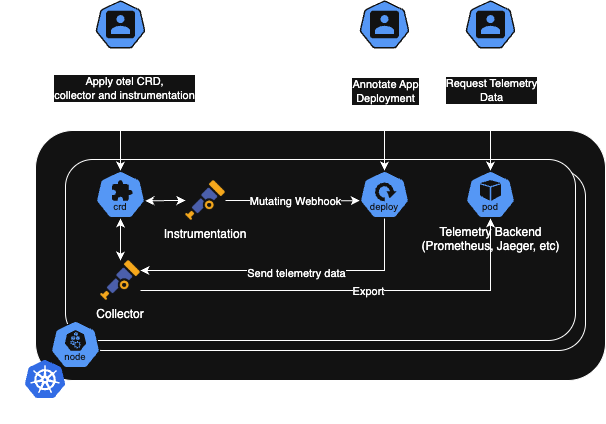
Image 1: How Automatic Instrumentation Works with the OpenTelemetry Operator
Setting Up Auto-Instrumentation with the OpenTelemetry Operator Link to heading
To enable auto-instrumentation using the OpenTelemetry Operator, follow these steps:
Install the OpenTelemetry Operator
kubectl apply -f https://github.com/open-telemetry/opentelemetry-operator/releases/latest/download/opentelemetry-operator.yamlCreate an OpenTelemetry Collector If needed, create your own Otel Collector. In the example below, we’re using a Deployment mode — ensure this fits your architecture. Well, we can also use it as a Sidecar, StatefulSet or Daemonset.
 apiVersion: opentelemetry.io/v1beta1
 kind: OpenTelemetryCollector
 metadata:
   name: simplest
 spec:
   config:
     receivers:
       otlp:
         protocols:
           grpc:
             endpoint: 0.0.0.0:4317
           http:
             endpoint: 0.0.0.0:4318
     processors:
       memory_limiter:
         check_interval: 1s
         limit_percentage: 75
         spike_limit_percentage: 15
       batch:
         send_batch_size: 10000
         timeout: 10s
     exporters:
       debug: {}
     service:
       pipelines:
         traces:
           receivers: [otlp]
           processors: [memory_limiter, batch]
           exporters: [debug]
Create an Auto-Instrumentation Configuration Define an
Instrumentationresource to apply auto-instrumentation to your workloads:apiVersion: opentelemetry.io/v1alpha1 kind: Instrumentation metadata: name: my-instrumentation spec: exporter: endpoint: http://otel-collector:4317 propagators: - tracecontext - baggage - b3 sampler: type: parentbased_traceidratio argument: "0.25" python: env: - name: OTEL_EXPORTER_OTLP_ENDPOINT value: http://otel-collector:4318 dotnet: env: - name: OTEL_EXPORTER_OTLP_ENDPOINT value: http://otel-collector:4318 go: env: - name: OTEL_EXPORTER_OTLP_ENDPOINT value: http://otel-collector:4318Annotate Deployments to Enable Auto-Instrumentation Choose the annotation according to your language. The example below uses Java — see the full documentation to find your language. Add the following annotation to your Kubernetes Deployments:
metadata:
  annotations:
    instrumentation.opentelemetry.io/inject-java: "true"
Verify Instrumentation Check if telemetry signals are being collected in your observability backend (Jaeger, Tempo, Loki, Prometheus, etc.), and adjust configurations if needed.
Tips Link to heading
Learn about manual instrumentation: Despite its benefits, auto-instrumentation doesn’t fully replace manual instrumentation. For deeper insights and custom attributes, manual instrumentation is still needed. A hybrid approach — where auto-instrumentation provides a baseline and manual instrumentation is added to critical services — can be most effective.
Test auto-instrumentation in a sandbox: Languages like Python, JavaScript, and Go may have quirks when agents inject their respective instrumentation libraries at runtime.
Monitor overhead with metrics: Track the impact of auto-instrumentation on your application by monitoring latency, CPU usage, and memory allocation.
Abstract instrumentation rollout: Automate the rollout of instrumentation either by templating your Helm charts with dynamic annotations or using tools like Kyverno to apply it based on labels, namespaces, or team ownership.
Enrich logs with trace context: Even with auto-instrumentation, you can include
trace_idandspan_idin your logs, which helps a lot during debugging. This can be done via auto-log enrichment or directly in the logger configuration.
Conclusion Link to heading
Auto-instrumentation with the OpenTelemetry Operator is a powerful strategy to scale observability without requiring significant effort from development teams. However, for full and optimized visibility, combining it with manual instrumentation remains essential.